整理官方文件 https://linkerd.io/2.10/features/ 如下:
HTTP, HTTP/2, and gRPC Proxying
Linkerd can proxy all TCP connections, and will automatically enable advanced features (including metrics, load balancing, retries, and more) for HTTP, HTTP/2, and gRPC connections.
TCP Proxying and Protocol Detection
Linkerd is capable of proxying all TCP traffic, including TLS connections, WebSockets, and HTTP tunneling.
In most cases, Linkerd can do this without configuration. To do this, Linkerd performs protocol detection to determine whether traffic is HTTP or HTTP/2 (including gRPC). If Linkerd detects that a connection is HTTP or HTTP/2, Linkerd will automatically provide HTTP-level metrics and routing.
If Linkerd cannot determine that a connection is using HTTP or HTTP/2**, Linkerd will proxy the connection as a plain TCP connection, applying mTLS and providing byte-level metrics** as usual.
Note Client-initiated HTTPS will be treated as TCP, not as HTTP, as Linkerd will not be able to observe the HTTP transactions on the connection.
Configuring protocol detection
( We ITRI currently get TCP info from Layer 4 Network Stack in Kernel )
In some cases, Linkerd’s protocol detection cannot function because it is not provided with enough client data. This can result in a 10-second delay in creating the connection as the protocol detection code waits for more data. This situation is often encountered when using “server-speaks-first” protocols, or protocols where the server sends data before the client does, and can be avoided by supplying Linkerd with some additional configuration.
There are two basic mechanisms for configuring protocol detection: opaque ports and skip ports. Marking a port as opaque instructs Linkerd to proxy the connection as a TCP stream and not to attempt protocol detection. Marking a port as skip bypasses the proxy entirely.
By default, Linkerd automatically marks some ports as opaque, including the default ports for SMTP, MySQL, PostgresQL, and Memcache. Services that speak those protocols, use the default ports, and are inside the cluster do not need further configuration.
The following table summarizes some common server-speaks-first protocols and the configuration necessary to handle them. The “on-cluster config” column refers to the configuration when the destination is on the same cluster; the “off-cluster config” to when the destination is external to the cluster.
some common server-speaks-first protocols
- No configuration is required if the standard port is used. If a non-standard port is used, you must mark the port as opaque.
Retries and Timeouts
Automatic retries are one the most powerful and useful mechanisms a service mesh has for gracefully handling partial or transient application failures.
Timeouts work hand in hand with retries. Once requests are retried a certain number of times, it becomes important to limit the total amount of time a client waits before giving up entirely. Imagine a number of retries forcing a client to wait for 10 seconds.
Automatic mTLS
By default, Linkerd automatically enables mutual Transport Layer Security (mTLS) for most TCP traffic between meshed pods, by establishing and authenticating secure, private TLS connections between Linkerd proxies. This means that Linkerd can add authenticated, encrypted communication to your application with very little work on your part.
Telemetry and Monitoring
One of Linkerd’s most powerful features is its extensive set of tooling around observability—the measuring and reporting of observed behavior in meshed applications
To gain access to Linkerd’s observability features you only need to install the Viz extension:
linkerd viz install | kubectl apply -f -
Linkerd’s telemetry and monitoring features function automatically, without requiring any work on the part of the developer. These features include:
- Recording of top-line (“golden”) metrics (request volume, success rate, and latency distributions) for HTTP, HTTP/2, and gRPC traffic.
- Recording of TCP-level metrics (bytes in/out, etc) for other TCP traffic. (We ITRI record TCP and UDP Tx/Rx bytes both)
- Reporting metrics per service, per caller/callee pair, or per route/path (with Service Profiles).
- Generating topology graphs that display the runtime relationship between services.
- Live, on-demand request sampling.
This data can be consumed in several ways:
- Through the Linkerd CLI, e.g. with
linkerd viz statandlinkerd viz routes. - Through the Linkerd dashboard, and pre-built Grafana dashboards.
- Directly from Linkerd’s built-in Prometheus instance
Golden metrics
Success Rate
This is the percentage of successful requests during a time window (1 minute by default).
In the output of the command linkerd viz routes -o wide, this metric is split into EFFECTIVE_SUCCESS and ACTUAL_SUCCESS. For routes configured with retries, the former calculates the percentage of success after retries (as perceived by the client-side), and the latter before retries (which can expose potential problems with the service).
Traffic (Requests Per Second)
This gives an overview of how much demand is placed on the service/route. As with success rates, linkerd viz routes --o wide splits this metric into EFFECTIVE_RPS and ACTUAL_RPS, corresponding to rates after and before retries respectively.
Latencies ( We ITRI's latency is defined as time to client → server → client . We also have service's response time)
Times taken to service requests per service/route are split into 50th, 95th and 99th percentiles. Lower percentiles give you an overview of the average performance of the system, while tail percentiles help catch outlier behavior.
Load Balancing
For HTTP, HTTP/2, and gRPC connections, Linkerd automatically load balances requests across all destination endpoints without any configuration required. (For TCP connections, Linkerd will balance connections.)
Linkerd uses an algorithm called EWMA, or exponentially weighted moving average, to automatically send requests to the fastest endpoints. This load balancing can improve end-to-end latencies.
Service discovery
For destinations that are not in Kubernetes, Linkerd will balance across endpoints provided by DNS.
For destinations that are in Kubernetes, Linkerd will look up the IP address in the Kubernetes API. If the IP address corresponds to a Service, Linkerd will load balance across the endpoints of that Service and apply any policy from that Service’s Service Profile. On the other hand, if the IP address corresponds to a Pod, Linkerd will not perform any load balancing or apply any Service Profiles.
Load balancing gRPC
Linkerd’s load balancing is particularly useful for gRPC (or HTTP/2) services in Kubernetes, for which Kubernetes’s default load balancing is not effective.
Automatic Proxy Injection
Linkerd automatically adds the data plane proxy to pods when the linkerd.io/inject: enabled annotation is present on a namespace or any workloads, such as deployments or pods. This is known as “proxy injection”. ( Here a lot of details in Adding Your Services to Linkerd)
Details
Proxy injection is implemented as a Kubernetes admission webhook. This means that the proxies are added to pods within the Kubernetes cluster itself, regardless of whether the pods are created by kubectl, a CI/CD system, or any other system.
For each pod, two containers are injected:
linkerd-init, a Kubernetes Init Container that configuresiptablesto automatically forward all incoming and outgoing TCP traffic through the proxy. (Note that this container is not present if the Linkerd CNI Plugin has been enabled.)linkerd-proxy, the Linkerd data plane proxy itself.
Note that simply adding the annotation to a resource with pre-existing pods will not automatically inject those pods. You will need to update the pods (e.g. with kubectl rollout restart etc.) for them to be injected. This is because Kubernetes does not call the webhook until it needs to update the underlying resources.
CNI Plugin
Linkerd installs can be configured to run a CNI plugin that rewrites each pod’s iptables rules automatically. Rewriting iptables is required for routing network traffic through the pod’s linkerd-proxy container. When the CNI plugin is enabled, individual pods no longer need to include an init container that requires the NET_ADMIN capability to perform rewriting. This can be useful in clusters where that capability is restricted by cluster administrators.
Distributed Tracing
(We ITRI don't require code changes. We provide the downstream of related trajectories )
Linkerd can be configured to emit trace spans from the proxies, allowing you to see exactly what time requests and responses spend inside.
Unlike most of the features of Linkerd, distributed tracing requires both code changes and configuration. (You can read up on Distributed tracing in the service mesh: four myths for why this is.)
Furthermore, Linkerd provides many of the features that are often associated with distributed tracing, without requiring configuration or application changes, including:
- Live service topology and dependency graphs
- Aggregated service health, latencies, and request volumes
- Aggregated path / route health, latencies, and request volumes
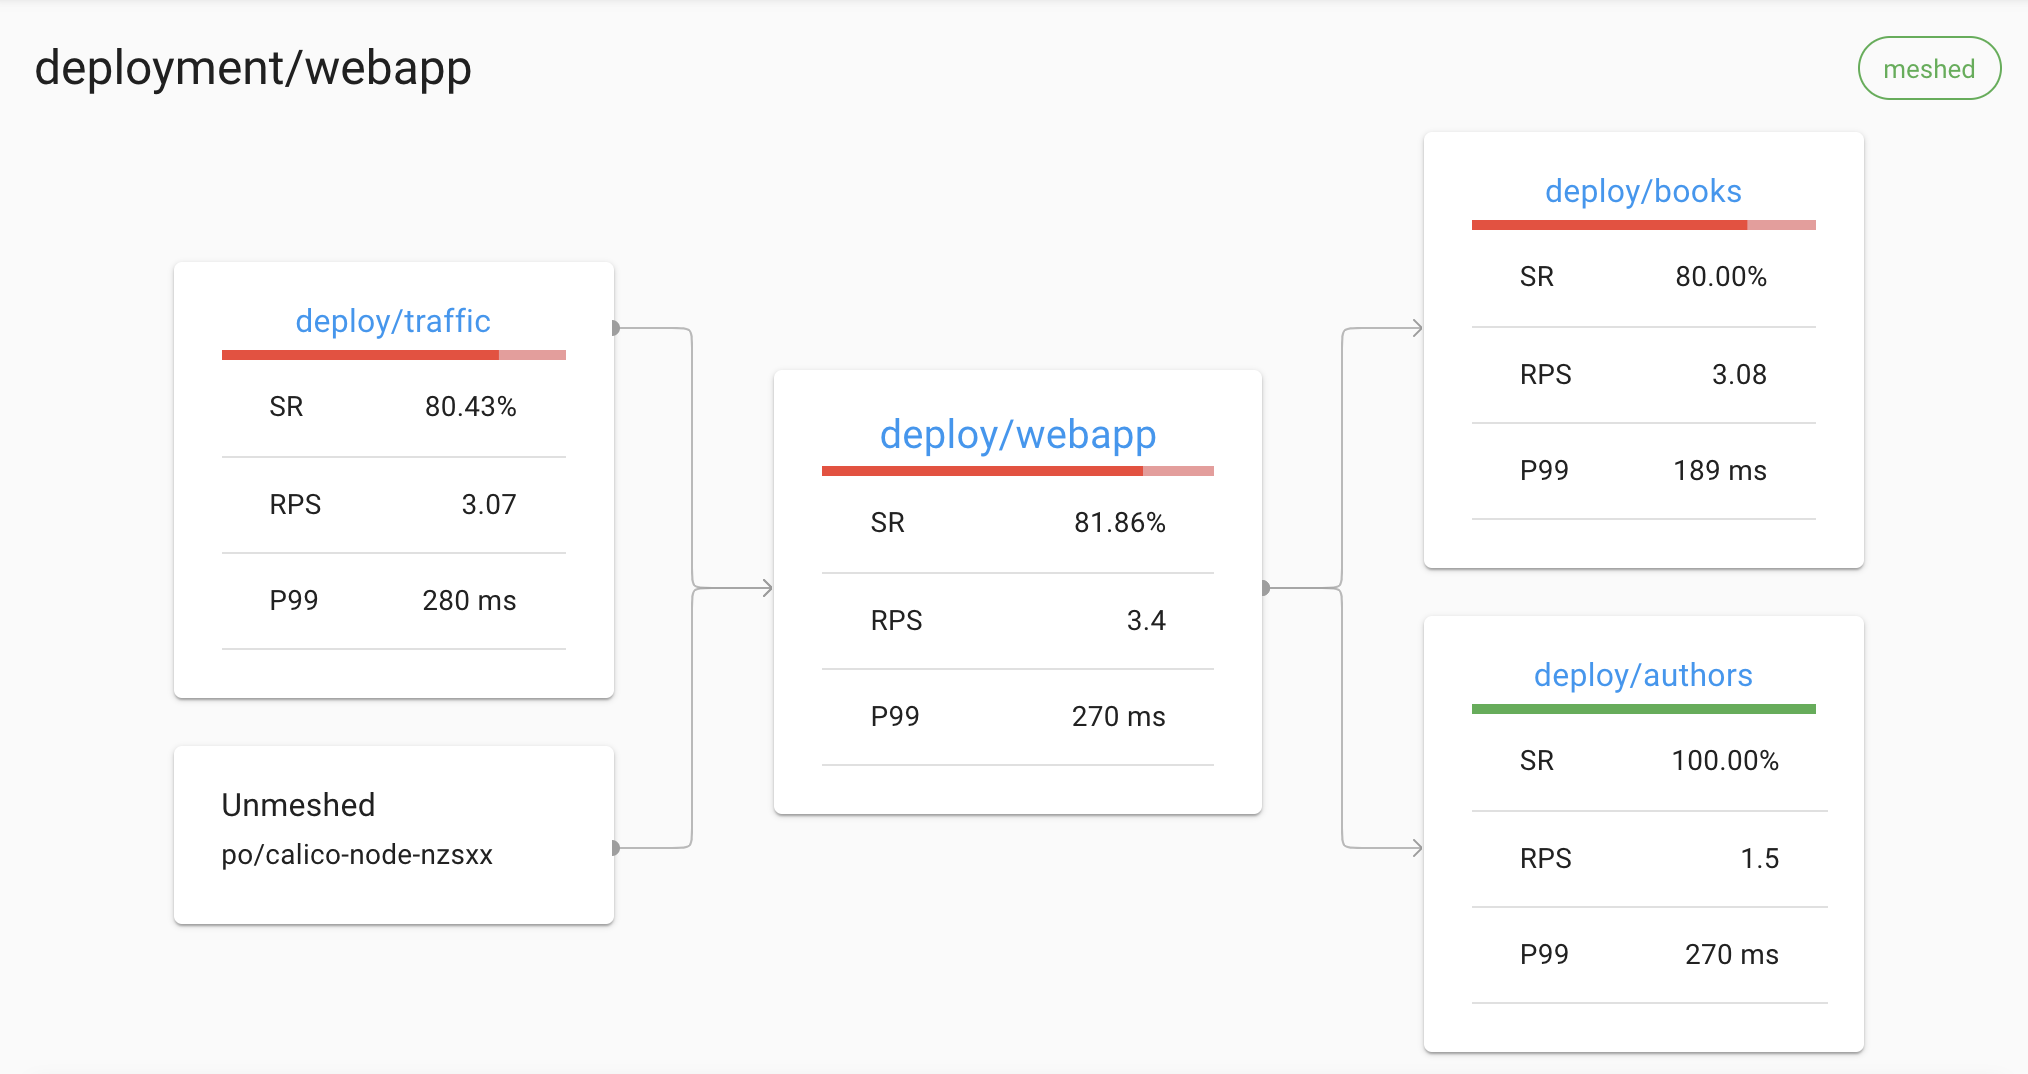
For example, Linkerd can display a live topology of all incoming and outgoing dependencies for a service, without requiring distributed tracing or any other such application modification:
The Linkerd dashboard showing an automatically generated topology graph