First, I use the following code to build my TF graph.
W = tf.get_variable(shape=[], name='weights')
b = tf.get_variable(shape=[], name='bias')
x_observed = tf.placeholder(shape=[None],
                            dtype=tf.float32,
                            name='x_observed')
y_pred = W * x_observed + b
learning_rate = 0.025

y_observed = tf.placeholder(shape=[None], dtype=tf.float32, name='y_observed')

loss_op = tf.reduce_mean(tf.square(y_pred - y_observed))
optimizer_op = tf.train.GradientDescentOptimizer(learning_rate)
train_op = optimizer_op.minimize(loss_op)
I try to dump all the temporary graphs during the XLA JIT compilation by the following flags and env variable. So, after execution, you will get a lot of pbtxt files and log.export TF_CPP_MIN_VLOG_LEVEL=2
TF_XLA_FLAGS="--xla_hlo_profile --tf_xla_clustering_debug --tf_dump_graph_prefix=/tmp --vmodule=xla_compiler=2 --xla_hlo_graph_path=/tmp --xla_generate_hlo_graph=.*" python test.py 2>&1 | tee xla_log.txt
Unfortunately, protobuf library cannot read some of the XLA dump pbtxt files so that I only can show what I get.
The way to convert pbtxt file to PNG image is here for reference:
The way to convert pbtxt file to PNG image is here for reference:
import tensorflow as tf
import sys

from google.protobuf import text_format
from graphviz import Digraph

dot = Digraph()

if len(sys.argv) != 2:
  sys.exit("convert <graphdef.pb>")

with tf.gfile.FastGFile(sys.argv[1], 'rb') as f:
  graph_def = tf.GraphDef()
  text_format.Merge(f.read(), graph_def)
  tf.import_graph_def(graph_def)

  for n in graph_def.node:
    dot.node(n.name, label=n.name)

    for i in n.input:
      # Edges are determined by the names of the nodes
      dot.edge(i, n.name)

dot.format = 'png'
dot.render(sys.argv[1] + ".gv", view=True)
1. W = tf.get_variable(shape=[], name='weights')
2. b = tf.get_variable(shape=[], name='bias')
The reason why we only to see these is that the following explanation about XLA JIT Compilation is all around them.
Actually, XLA JIT compilation process is very complicated. I only want to list the process items of XLA JIT Compilation in execution period.
Before going into HLO optimization phase, TensorFlow will do JIT Compilation Pass first, which contains 3 main steps:
1. Mark For Compilation Pass:
2. Encapsulate Subgraph Pass:
3. Build Xla Launch Ops Pass:
Then, before rendering low-level assembly code for the graph, TensorFlow will run HLO Pass Pipeline Optimization using HLO IR, which contains several steps:
1. Optimization:

2. Simplification:


3. Conv Canonicalization:

4. Layout Assignment:

5. Fusion:

6. Reduce Precision:

7. GPU IR Emit Prepare:

The HLO IR looks like this:

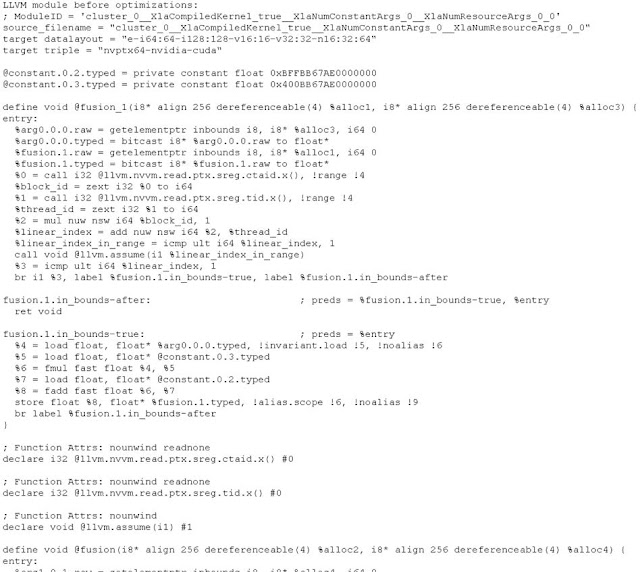
The LLVM IR looks like this:

In this phase, XLA can use GPU Compiler to run backend for generating binary executable code based on LLVM IR, but this is not in my discussion this time.


No comments:
Post a Comment