Tuesday, September 21, 2021

[Service Mesh] Linkerd 2 Demo Case 介紹


Linkerd2 Demo Case 介紹

步驟

###Step 1: Install the CLI###
curl -sL run.linkerd.io/install | sh
export PATH=$PATH:/home/liudanny/.linkerd2/bin

###Step 2: Validate your Kubernetes cluster###
linkerd check --pre

###Step 3: Install the control plane onto your cluster###
linkerd install | kubectl apply -f -
linkerd check
linkerd viz install | kubectl apply -f - # on-cluster metrics stack

###Step 4: Explore Linkerd
linkerd viz dashboard &
linkerd -n **linkerd-viz** viz top deploy/web

###Step 5: Install the demo app###
curl -sL <https://run.linkerd.io/emojivoto.yml> \\
  | kubectl apply -f -
#add Linkerd to emojivoto by running
kubectl get -n emojivoto deploy -o yaml \\
  | linkerd inject - \\
  | kubectl apply -f -
linkerd -n emojivoto check --proxy

###Step 6: Watch it run###
linkerd -n emojivoto viz stat deploy
linkerd -n emojivoto viz top deploy
linkerd -n emojivoto viz tap deploy/web

###Step 7 (uninstall)###
kubectl get -n emojivoto deploy -o yaml \\
  | linkerd uninject - \\
  | kubectl apply -f -
curl -sL <https://run.linkerd.io/emojivoto.yml> \\
  | kubectl delete -f -
linkerd viz uninstall | kubectl delete -f -
linkerd uninstall | kubectl delete -f -

實驗

###測試自己的namespace
$kubectl get -n default deploy -o yaml \\
  | linkerd inject - \\
  | kubectl apply -f -

$kubectl exec tiefighter -- curl -s -XPOST deathstar.default.svc.cluster.local/v1/request-landing

#uninject 
$kubectl get -n default deploy -o yaml \\
  | linkerd uninject - \\
  | kubectl apply -f -

### not work!!!
$kubectl get -n default pod -o yaml \\
  | linkerd inject - \\
  | kubectl apply -f -
#uninject 
$kubectl get -n default pod -o yaml \\
  | linkerd uninject - \\
  | kubectl apply -f -

心得

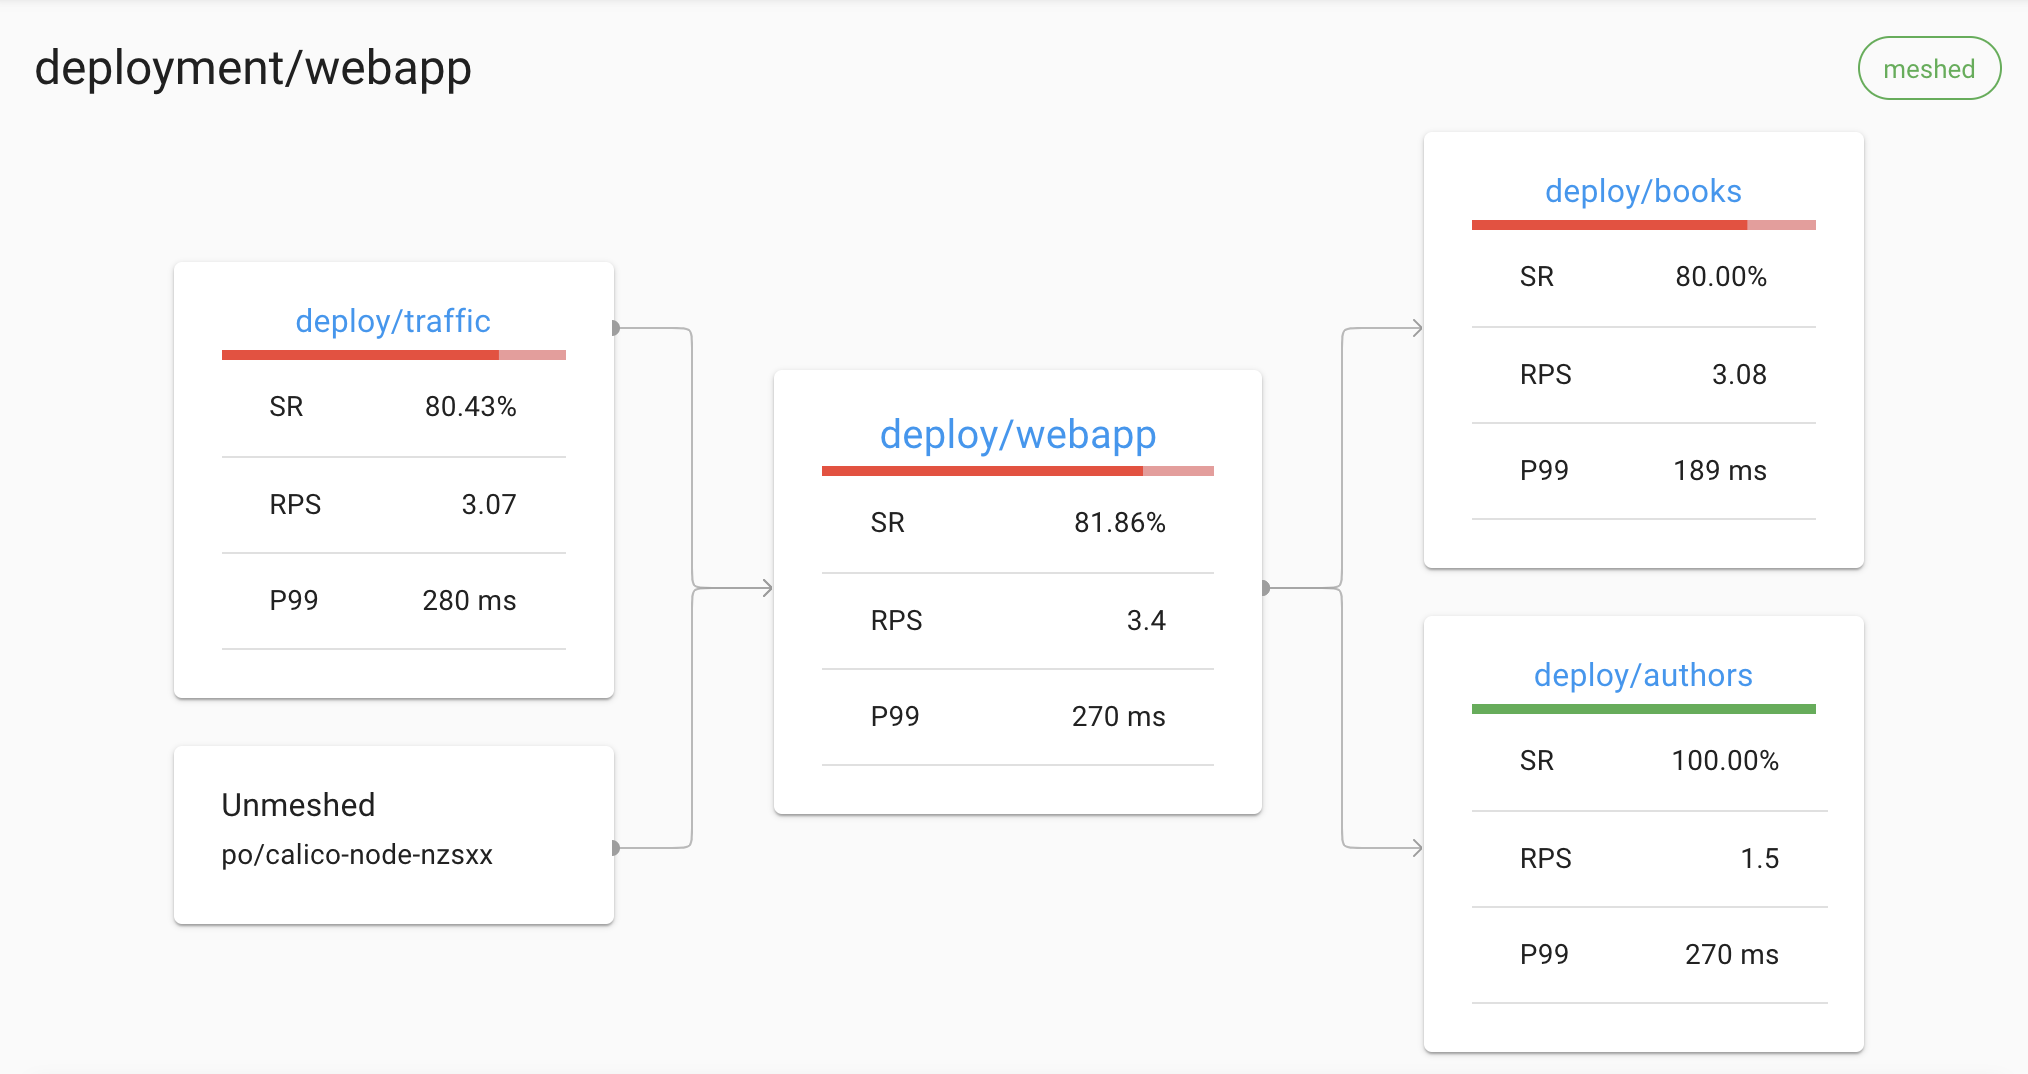
View the Linkerd dashboard and see all the services in the demo app. Since the demo app comes with a load generator, we can see live traffic metrics HTTP/2(gRPC)和HTTP/1(web frontend) by running: linkerd -n emojivoto viz stat deploy

This will show the “golden” metrics for each deployment:

  • Success rates
  • Request rates
  • Latency distribution percentiles

Inject function is very convenient for users.

There is no service perspective for metrics, but deployment/Pods/... can kind of cover this.

相關執行結果參考

$ k get all -n emojivoto
NAME                            READY   STATUS    RESTARTS   AGE
pod/emoji-696d9d8f95-p2xv5      2/2     Running   0          64m
pod/vote-bot-6d7677bb68-tmbfq   2/2     Running   0          64m
pod/voting-ff4c54b8d-whssp      2/2     Running   0          64m
pod/web-5f86686c4d-l8lcb        2/2     Running   0          64m

NAME                 TYPE        CLUSTER-IP       EXTERNAL-IP   PORT(S)             AGE
service/emoji-svc    ClusterIP   10.106.16.101    <none>        8080/TCP,8801/TCP   105m
service/voting-svc   ClusterIP   10.109.94.225    <none>        8080/TCP,8801/TCP   105m
service/web-svc      ClusterIP   10.100.247.154   <none>        80/TCP              105m

NAME                       READY   UP-TO-DATE   AVAILABLE   AGE
deployment.apps/emoji      1/1     1            1           105m
deployment.apps/vote-bot   1/1     1            1           105m
deployment.apps/voting     1/1     1            1           105m
deployment.apps/web        1/1     1            1           105m

NAME                                  DESIRED   CURRENT   READY   AGE
replicaset.apps/emoji-66ccdb4d86      0         0         0       105m
replicaset.apps/emoji-696d9d8f95      1         1         1       64m
replicaset.apps/vote-bot-69754c864f   0         0         0       105m
replicaset.apps/vote-bot-6d7677bb68   1         1         1       64m
replicaset.apps/voting-f999bd4d7      0         0         0       105m
replicaset.apps/voting-ff4c54b8d      1         1         1       64m
replicaset.apps/web-5f86686c4d        1         1         1       64m
replicaset.apps/web-79469b946f        0         0         0       105m

$ linkerd -n emojivoto viz stat deploy
NAME       MESHED   SUCCESS      RPS   LATENCY_P50   LATENCY_P95   LATENCY_P99   TCP_CONN
emoji         1/1   100.00%   2.3rps           1ms           1ms           1ms          3
vote-bot      1/1   100.00%   0.3rps           1ms           1ms           1ms          1
voting        1/1    87.01%   1.3rps           1ms           1ms           2ms          3
web           1/1    91.91%   2.3rps           2ms          16ms          19ms          3
$ linkerd -n emojivoto viz top deploy
(press q to quit)
(press a/LeftArrowKey to scroll left, d/RightArrowKey to scroll right)

Source                     Destination             Method      Path                                                    Count    Best   Worst    Last  Success Rate
web-5f86686c4d-l8lcb       emoji-696d9d8f95-p2xv5  POST        /emojivoto.v1.EmojiService/ListAll                         42   562µs     5ms   937µs       100.00%
vote-bot-6d7677bb68-tmbfq  web-5f86686c4d-l8lcb    GET         /api/list                                                  42     3ms    13ms     9ms       100.00%
web-5f86686c4d-l8lcb       emoji-696d9d8f95-p2xv5  POST        /emojivoto.v1.EmojiService/FindByShortcode                 42   553µs    13ms     2ms       100.00%
vote-bot-6d7677bb68-tmbfq  web-5f86686c4d-l8lcb    GET         /api/vote                                                  41     5ms    21ms     6ms        87.80%
web-5f86686c4d-l8lcb       voting-ff4c54b8d-whssp  POST        /emojivoto.v1.VotingService/VoteDoughnut                    6   926µs     3ms     2ms         0.00%
web-5f86686c4d-l8lcb       voting-ff4c54b8d-whssp  POST        /emojivoto.v1.VotingService/VoteMrsClaus                    4     1ms     2ms     2ms       100.00%
web-5f86686c4d-l8lcb       voting-ff4c54b8d-whssp  POST        /emojivoto.v1.VotingService/VoteRocket                      2     2ms     3ms     3ms       100.00%
web-5f86686c4d-l8lcb       voting-ff4c54b8d-whssp  POST        /emojivoto.v1.VotingService/VotePointUp2                    2     2ms     3ms     3ms       100.00%
web-5f86686c4d-l8lcb       voting-ff4c54b8d-whssp  POST        /emojivoto.v1.VotingService/VoteCrossedSwords               2     2ms     3ms     3ms       100.00%
web-5f86686c4d-l8lcb       voting-ff4c54b8d-whssp  POST        /emojivoto.v1.VotingService/VoteWorldMap                    2   739µs     2ms     2ms       100.00%
web-5f86686c4d-l8lcb       voting-ff4c54b8d-whssp  POST        /emojivoto.v1.VotingService/VoteDog                         2     2ms     2ms     2ms       100.00%
web-5f86686c4d-l8lcb       voting-ff4c54b8d-whssp  POST        /emojivoto.v1.VotingService/VoteOkWoman                     2   951µs     2ms     2ms       100.00%
web-5f86686c4d-l8lcb       voting-ff4c54b8d-whssp  POST        /emojivoto.v1.VotingService/VoteNerdFace                    2     2ms     9ms     9ms       100.00%
web-5f86686c4d-l8lcb       voting-ff4c54b8d-whssp  POST        /emojivoto.v1.VotingService/VoteConstructionWorkerMan       2     1ms     3ms     3ms       100.00%
web-5f86686c4d-l8lcb       voting-ff4c54b8d-whssp  POST        /emojivoto.v1.VotingService/VoteCheckeredFlag               2   863µs     3ms   863µs       100.00%
web-5f86686c4d-l8lcb       voting-ff4c54b8d-whssp  POST        /emojivoto.v1.VotingService/Vote100                         2   894µs     2ms   894µs       100.00%
web-5f86686c4d-l8lcb       voting-ff4c54b8d-whssp  POST        /emojivoto.v1.VotingService/VotePizza                       2     1ms     3ms     3ms       100.00%
web-5f86686c4d-l8lcb       voting-ff4c54b8d-whssp  POST        /emojivoto.v1.VotingService/VoteJackOLantern                2   884µs     3ms     3ms       100.00%
web-5f86686c4d-l8lcb       voting-ff4c54b8d-whssp  POST        /emojivoto.v1.VotingService/VoteManDancing                  2   761µs     1ms     1ms       100.00%
web-5f86686c4d-l8lcb       voting-ff4c54b8d-whssp  POST        /emojivoto.v1.VotingService/VoteBeachUmbrella               2     1ms     2ms     1ms       100.00%
web-5f86686c4d-l8lcb       voting-ff4c54b8d-whssp  POST        /emojivoto.v1.VotingService/VoteNoGoodWoman                 2     1ms     2ms     2ms       100.00%
web-5f86686c4d-l8lcb       voting-ff4c54b8d-whssp  POST        /emojivoto.v1.VotingService/VoteGuardsman                   2   968µs     2ms     2ms       100.00%
**$ linkerd -n emojivoto viz tap deploy/web**
req id=11:0 proxy=in  src=10.244.109.92:46446 dst=10.244.109.115:8080 tls=true :method=GET :authority=web-svc.emojivoto:80 :path=/api/list
req id=11:1 proxy=out src=10.244.109.115:55194 dst=10.244.109.109:8080 tls=true :method=POST :authority=emoji-svc.emojivoto:8080 :path=/emojivoto.v1.EmojiService/ListAll
rsp id=11:1 proxy=out src=10.244.109.115:55194 dst=10.244.109.109:8080 tls=true :status=200 latency=1792µs
end id=11:1 proxy=out src=10.244.109.115:55194 dst=10.244.109.109:8080 tls=true grpc-status=OK duration=193µs response-length=2140B
rsp id=11:0 proxy=in  src=10.244.109.92:46446 dst=10.244.109.115:8080 tls=true :status=200 latency=4294µs
end id=11:0 proxy=in  src=10.244.109.92:46446 dst=10.244.109.115:8080 tls=true duration=358µs response-length=4513B
req id=11:2 proxy=in  src=10.244.109.92:46446 dst=10.244.109.115:8080 tls=true :method=GET :authority=web-svc.emojivoto:80 :path=/api/vote
req id=11:3 proxy=out src=10.244.109.115:55194 dst=10.244.109.109:8080 tls=true :method=POST :authority=emoji-svc.emojivoto:8080 :path=/emojivoto.v1.EmojiService/FindByShortcode
rsp id=11:3 proxy=out src=10.244.109.115:55194 dst=10.244.109.109:8080 tls=true :status=200 latency=1657µs
end id=11:3 proxy=out src=10.244.109.115:55194 dst=10.244.109.109:8080 tls=true grpc-status=OK duration=175µs response-length=25B
req id=11:4 proxy=out src=10.244.109.115:33470 dst=10.244.109.84:8080 tls=true :method=POST :authority=voting-svc.emojivoto:8080 :path=/emojivoto.v1.VotingService/VoteDoughnut
rsp id=11:4 proxy=out src=10.244.109.115:33470 dst=10.244.109.84:8080 tls=true :status=200 latency=2217µs
end id=11:4 proxy=out src=10.244.109.115:33470 dst=10.244.109.84:8080 tls=true grpc-status=Unknown duration=161µs response-length=0B
rsp id=11:2 proxy=in  src=10.244.109.92:46446 dst=10.244.109.115:8080 tls=true :status=500 latency=8272µs
end id=11:2 proxy=in  src=10.244.109.92:46446 dst=10.244.109.115:8080 tls=true duration=171µs response-length=51B
req id=11:5 proxy=in  src=10.244.109.92:46446 dst=10.244.109.115:8080 tls=true :method=GET :authority=web-svc.emojivoto:80 :path=/api/list
req id=11:6 proxy=out src=10.244.109.115:55194 dst=10.244.109.109:8080 tls=true :method=POST :authority=emoji-svc.emojivoto:8080 :path=/emojivoto.v1.EmojiService/ListAll
rsp id=11:6 proxy=out src=10.244.109.115:55194 dst=10.244.109.109:8080 tls=true :status=200 latency=1483µs
end id=11:6 proxy=out src=10.244.109.115:55194 dst=10.244.109.109:8080 tls=true grpc-status=OK duration=145µs response-length=2140B
rsp id=11:5 proxy=in  src=10.244.109.92:46446 dst=10.244.109.115:8080 tls=true :status=200 latency=5621µs
end id=11:5 proxy=in  src=10.244.109.92:46446 dst=10.244.109.115:8080 tls=true duration=336µs response-length=4513B
req id=11:7 proxy=in  src=10.244.109.92:46446 dst=10.244.109.115:8080 tls=true :method=GET :authority=web-svc.emojivoto:80 :path=/api/vote
req id=11:8 proxy=out src=10.244.109.115:55194 dst=10.244.109.109:8080 tls=true :method=POST :authority=emoji-svc.emojivoto:8080 :path=/emojivoto.v1.EmojiService/FindByShortcode
rsp id=11:8 proxy=out src=10.244.109.115:55194 dst=10.244.109.109:8080 tls=true :status=200 latency=1477µs
end id=11:8 proxy=out src=10.244.109.115:55194 dst=10.244.109.109:8080 tls=true grpc-status=OK duration=206µs response-length=28B
req id=11:9 proxy=out src=10.244.109.115:33470 dst=10.244.109.84:8080 tls=true :method=POST :authority=voting-svc.emojivoto:8080 :path=/emojivoto.v1.VotingService/VoteManDancing
rsp id=11:9 proxy=out src=10.244.109.115:33470 dst=10.244.109.84:8080 tls=true :status=200 latency=1560µs
end id=11:9 proxy=out src=10.244.109.115:33470 dst=10.244.109.84:8080 tls=true grpc-status=OK duration=144µs response-length=5B
rsp id=11:7 proxy=in  src=10.244.109.92:46446 dst=10.244.109.115:8080 tls=true :status=200 latency=7140µs
end id=11:7 proxy=in  src=10.244.109.92:46446 dst=10.244.109.115:8080 tls=true duration=96µs response-length=0B
req id=11:10 proxy=in  src=10.244.109.92:46446 dst=10.244.109.115:8080 tls=true :method=GET :authority=web-svc.emojivoto:80 :path=/api/list
req id=11:11 proxy=out src=10.244.109.115:55194 dst=10.244.109.109:8080 tls=true :method=POST :authority=emoji-svc.emojivoto:8080 :path=/emojivoto.v1.EmojiService/ListAll
rsp id=11:11 proxy=out src=10.244.109.115:55194 dst=10.244.109.109:8080 tls=true :status=200 latency=1855µs
end id=11:11 proxy=out src=10.244.109.115:55194 dst=10.244.109.109:8080 tls=true grpc-status=OK duration=375µs response-length=2140B
rsp id=11:10 proxy=in  src=10.244.109.92:46446 dst=10.244.109.115:8080 tls=true :status=200 latency=3786µs
end id=11:10 proxy=in  src=10.244.109.92:46446 dst=10.244.109.115:8080 tls=true duration=339µs response-length=4513B
req id=11:12 proxy=in  src=10.244.109.92:46446 dst=10.244.109.115:8080 tls=true :method=GET :authority=web-svc.emojivoto:80 :path=/api/vote


[Service Mesh] Linkerd2 Features 重點整理

 整理官方文件 https://linkerd.io/2.10/features/ 如下:

HTTP, HTTP/2, and gRPC Proxying

Linkerd can proxy all TCP connections, and will automatically enable advanced features (including metrics, load balancing, retries, and more) for HTTP, HTTP/2, and gRPC connections.

TCP Proxying and Protocol Detection

Linkerd is capable of proxying all TCP traffic, including TLS connections, WebSockets, and HTTP tunneling.

In most cases, Linkerd can do this without configuration. To do this, Linkerd performs protocol detection to determine whether traffic is HTTP or HTTP/2 (including gRPC). If Linkerd detects that a connection is HTTP or HTTP/2, Linkerd will automatically provide HTTP-level metrics and routing.

If Linkerd cannot determine that a connection is using HTTP or HTTP/2**, Linkerd will proxy the connection as a plain TCP connection, applying mTLS and providing byte-level metrics** as usual.

Note Client-initiated HTTPS will be treated as TCP, not as HTTP, as Linkerd will not be able to observe the HTTP transactions on the connection.

Configuring protocol detection

( We ITRI currently get TCP info from Layer 4 Network Stack in Kernel )

In some cases, Linkerd’s protocol detection cannot function because it is not provided with enough client data. This can result in a 10-second delay in creating the connection as the protocol detection code waits for more data. This situation is often encountered when using “server-speaks-first” protocols, or protocols where the server sends data before the client does, and can be avoided by supplying Linkerd with some additional configuration.

There are two basic mechanisms for configuring protocol detection: opaque ports and skip ports. Marking a port as opaque instructs Linkerd to proxy the connection as a TCP stream and not to attempt protocol detection. Marking a port as skip bypasses the proxy entirely.

By default, Linkerd automatically marks some ports as opaque, including the default ports for SMTP, MySQL, PostgresQL, and Memcache. Services that speak those protocols, use the default ports, and are inside the cluster do not need further configuration.

The following table summarizes some common server-speaks-first protocols and the configuration necessary to handle them. The “on-cluster config” column refers to the configuration when the destination is on the same cluster; the “off-cluster config” to when the destination is external to the cluster.

some common server-speaks-first protocols

  • No configuration is required if the standard port is used. If a non-standard port is used, you must mark the port as opaque.

Retries and Timeouts

Automatic retries are one the most powerful and useful mechanisms a service mesh has for gracefully handling partial or transient application failures.

Timeouts work hand in hand with retries. Once requests are retried a certain number of times, it becomes important to limit the total amount of time a client waits before giving up entirely. Imagine a number of retries forcing a client to wait for 10 seconds.

Automatic mTLS

By default, Linkerd automatically enables mutual Transport Layer Security (mTLS) for most TCP traffic between meshed pods, by establishing and authenticating secure, private TLS connections between Linkerd proxies. This means that Linkerd can add authenticated, encrypted communication to your application with very little work on your part.

Telemetry and Monitoring

One of Linkerd’s most powerful features is its extensive set of tooling around observability—the measuring and reporting of observed behavior in meshed applications

To gain access to Linkerd’s observability features you only need to install the Viz extension:

linkerd viz install | kubectl apply -f -

Linkerd’s telemetry and monitoring features function automatically, without requiring any work on the part of the developer. These features include:

  • Recording of top-line (“golden”) metrics (request volume, success rate, and latency distributions) for HTTP, HTTP/2, and gRPC traffic.
  • Recording of TCP-level metrics (bytes in/out, etc) for other TCP traffic. (We ITRI record TCP and UDP Tx/Rx bytes both)
  • Reporting metrics per service, per caller/callee pair, or per route/path (with Service Profiles).
  • Generating topology graphs that display the runtime relationship between services.
  • Live, on-demand request sampling.

This data can be consumed in several ways:

Golden metrics

Success Rate

This is the percentage of successful requests during a time window (1 minute by default).

In the output of the command linkerd viz routes -o wide, this metric is split into EFFECTIVE_SUCCESS and ACTUAL_SUCCESS. For routes configured with retries, the former calculates the percentage of success after retries (as perceived by the client-side), and the latter before retries (which can expose potential problems with the service).

Traffic (Requests Per Second)

This gives an overview of how much demand is placed on the service/route. As with success rates, linkerd viz routes --o wide splits this metric into EFFECTIVE_RPS and ACTUAL_RPS, corresponding to rates after and before retries respectively.

Latencies ( We ITRI's latency is defined as time to client → server → client . We also have service's response time)

Times taken to service requests per service/route are split into 50th, 95th and 99th percentiles. Lower percentiles give you an overview of the average performance of the system, while tail percentiles help catch outlier behavior.

Load Balancing

For HTTP, HTTP/2, and gRPC connections, Linkerd automatically load balances requests across all destination endpoints without any configuration required. (For TCP connections, Linkerd will balance connections.)

Linkerd uses an algorithm called EWMA, or exponentially weighted moving average, to automatically send requests to the fastest endpoints. This load balancing can improve end-to-end latencies.

Service discovery

For destinations that are not in Kubernetes, Linkerd will balance across endpoints provided by DNS.

For destinations that are in Kubernetes, Linkerd will look up the IP address in the Kubernetes API. If the IP address corresponds to a Service, Linkerd will load balance across the endpoints of that Service and apply any policy from that Service’s Service Profile. On the other hand, if the IP address corresponds to a Pod, Linkerd will not perform any load balancing or apply any Service Profiles.

Load balancing gRPC

Linkerd’s load balancing is particularly useful for gRPC (or HTTP/2) services in Kubernetes, for which Kubernetes’s default load balancing is not effective.

Automatic Proxy Injection

Linkerd automatically adds the data plane proxy to pods when the linkerd.io/inject: enabled annotation is present on a namespace or any workloads, such as deployments or pods. This is known as “proxy injection”. ( Here a lot of details in Adding Your Services to Linkerd)

Details

Proxy injection is implemented as a Kubernetes admission webhook. This means that the proxies are added to pods within the Kubernetes cluster itself, regardless of whether the pods are created by kubectl, a CI/CD system, or any other system.

For each pod, two containers are injected:

  1. linkerd-init, a Kubernetes Init Container that configures iptables to automatically forward all incoming and outgoing TCP traffic through the proxy. (Note that this container is not present if the Linkerd CNI Plugin has been enabled.)
  2. linkerd-proxy, the Linkerd data plane proxy itself.

Note that simply adding the annotation to a resource with pre-existing pods will not automatically inject those pods. You will need to update the pods (e.g. with kubectl rollout restart etc.) for them to be injected. This is because Kubernetes does not call the webhook until it needs to update the underlying resources.

CNI Plugin

Linkerd installs can be configured to run a CNI plugin that rewrites each pod’s iptables rules automatically. Rewriting iptables is required for routing network traffic through the pod’s linkerd-proxy container. When the CNI plugin is enabled, individual pods no longer need to include an init container that requires the NET_ADMIN capability to perform rewriting. This can be useful in clusters where that capability is restricted by cluster administrators.

Distributed Tracing

(We ITRI don't require code changes. We provide the downstream of related trajectories )

Linkerd can be configured to emit trace spans from the proxies, allowing you to see exactly what time requests and responses spend inside.

Unlike most of the features of Linkerd, distributed tracing requires both code changes and configuration. (You can read up on Distributed tracing in the service mesh: four myths for why this is.)

Furthermore, Linkerd provides many of the features that are often associated with distributed tracing, without requiring configuration or application changes, including:

  • Live service topology and dependency graphs
  • Aggregated service health, latencies, and request volumes
  • Aggregated path / route health, latencies, and request volumes

For example, Linkerd can display a live topology of all incoming and outgoing dependencies for a service, without requiring distributed tracing or any other such application modification:

The Linkerd dashboard showing an automatically generated topology graph

https://linkerd.io/images/books/webapp-detail.png


Monday, September 20, 2021

Some Docker run arguments mapping to Kubernetes YAML


Some Docker run arguments mapping to Kubernetes YAML
For instance: 

docker run -ti --rm -v /lib/modules:/lib/modules --net=host --pid=host --privileged \ ubuntu:18.04 bash 

Mapping Table:

SR-IOV Setting and Network device plugin for Multus CNI

 The main content is from here:

https://github.com/intel/sriov-network-device-plugin


Enable IOMMU

#Enable IOMMU
sudo su
vi /etc/default/grub

GRUB_DEFAULT=0
GRUB_TIMEOUT_STYLE=hidden
GRUB_TIMEOUT=0
GRUB_DISTRIBUTOR=`lsb_release -i -s 2> /dev/null || echo Debian`
GRUB_CMDLINE_LINUX_DEFAULT="maybe-ubiquity intel_iommu=on iommu=pt"
GRUB_CMDLINE_LINUX=""

Update grub and verify it
sudo update-grub
cd /boot/grub
vi grub.cfg

Enable SR-IOV PF card interfaces with DHCP

sudo vi /etc/netplan/00-installer-config.yaml

network:
ethernets:
enp4s0:
addresses:
- 140.96.27.152/24
gateway4: 140.96.27.254
nameservers:
addresses:
- 140.96.254.99
- 140.96.254.100
search:
- itri.ds
enp5s0f0:
dhcp4: yes
enp5s0f1:
dhcp4: yes

Install Golang for compiling SR-IOV's driver

In current development, Golang version in the environment is v1.14
cd /tmp
wget https://dl.google.com/go/go1.14.1.linux-amd64.tar.gz
tar xvf go1.14.1.linux-amd64.tar.gz
sudo mv go /usr/local

We can add the following content in ~/.profile or ~/.bashrc
#Golang path
export PATH=$PATH:/usr/local/go/bin
export GOPATH=$HOME/go
export PATH=$PATH:$GOPATH/bin

Then, renewing the shell sessions
source ~/.profile

Creating SR-IOV Virtual Functions

enable_vf.sh
#!/bin/bash
# -> enable VF
#
#
echo ""
SRIOV_CARD_PF1=enp5s0f0
#SRIOV_CARD_PF2=enp5s0f1
echo "PF status:"
echo "---"
sudo ethtool ${SRIOV_CARD_PF1}
echo ""
#sudo ethtool ${SRIOV_CARD_PF2}
echo "---"
echo ""
echo "VF status:"
echo "---"
if [ "$1" = "0" ]; then
# disable VF
sudo sh -c "echo 0 > /sys/class/net/${SRIOV_CARD_PF1}/device/sriov_numvfs"
#sudo sh -c "echo 0 > /sys/class/net/${SRIOV_CARD_PF2}/device/sriov_numvfs"
else
# enable VF
sudo sh -c "echo 6 > /sys/class/net/${SRIOV_CARD_PF1}/device/sriov_numvfs"
#sudo sh -c "echo 4 > /sys/class/net/${SRIOV_CARD_PF2}/device/sriov_numvfs"
fi
sudo lshw -class network -businfo
echo ""

Build SR-IOV CNI

Compile SR-IOV-CNI (supported from release 2.0+):
$ git clone https://github.com/intel/sriov-cni.git
$ cd sriov-cni
$ make -j8
$ sudo cp build/sriov /opt/cni/bin

Build and run SR-IOV network device plugin

If you want to build the docker image locally then follow the following steps:
Clone the sriov-network-device-plugin
$ git clone https://github.com/intel/sriov-network-device-plugin.git
$ cd sriov-network-device-plugin

Build docker image binary using make
$ make image

Install one compatible CNI meta plugin

Install Multus
$ git clone https://github.com/intel/multus-cni.git && cd multus-cni
$ cat ./images/multus-daemonset.yml | kubectl apply -f -
$ kubectl get pods --all-namespaces | grep -i multus

Network Object CRDs
Multus uses Custom Resource Definitions(CRDs) for defining additional network attachments. These network attachment CRDs follow the standards defined by K8s Network Plumbing Working Group(NPWG). Please refer to Multus documentation for more information.

Deploy the Device Plugin

The images directory contains example Dockerfile, sample specs along build scripts to deploy the SR-IOV device plugin as daemonset. Please see README.md for more information about the Docker images.
# Create ConfigMap
$ kubectl create -f deployments/configMap.yaml

# Create sriov-device-plugin-daemonset ( When rebooted, we need to delete and apply this yaml again )
$ kubectl create -f deployments/k8s-v1.16/sriovdp-daemonset.yaml

Create the SR-IOV Network CRD

$ cd sriov-network-device-plugin
$ kubectl create -f deployments/sriov-crd.yaml

On successful run, the allocatable resource list for the node should be updated with resources discovered by the plugin as shown below. Note that the resource name is appended with the -resource-prefix i.e. "intel.com/intel_sriov_netdevice".
$ kubectl get node node1 -o json | jq '.status.allocatable'
{
"cpu": "8",
"ephemeral-storage": "885084245370",
"hugepages-1Gi": "0",
"hugepages-2Mi": "0",
"intel.com/intel_sriov_dpdk": "0",
"intel.com/intel_sriov_netdevice": "6",
"intel.com/mlnx_sriov_rdma": "0",
"memory": "16203124Ki",
"pods": "110"
}

Check SRIOV Network in details

$ kubectl get network-attachment-definitions.k8s.cni.cncf.io --all-namespaces
NAMESPACE NAME AGE
default sriov-net1 14h

$ kubectl describe network-attachment-definitions.k8s.cni.cncf.io sriov-net1
Name: sriov-net1
Namespace: default
Labels: <none>
Annotations: k8s.v1.cni.cncf.io/resourceName: intel.com/intel_sriov_netdevice
API Version: k8s.cni.cncf.io/v1
Kind: NetworkAttachmentDefinition
Metadata:
Creation Timestamp: 2020-09-09T09:58:36Z
Generation: 1
Managed Fields:
API Version: k8s.cni.cncf.io/v1
Fields Type: FieldsV1
fieldsV1:
f:metadata:
f:annotations:
.:
f:k8s.v1.cni.cncf.io/resourceName:
f:spec:
.:
f:config:
Manager: kubectl-create
Operation: Update
Time: 2020-09-09T09:58:36Z
Resource Version: 29832
Self Link: /apis/k8s.cni.cncf.io/v1/namespaces/default/network-attachment-definitions/sriov-net1
UID: b1dd915b-9d70-4a33-9aee-66afdf7551c2
Spec:
Config: { "type": "sriov", "cniVersion": "0.3.1", "name": "sriov-network", "ipam": { "type": "host-local", "subnet": "10.56.217.0/24", "routes": [{ "dst": "0.0.0.0/0" }], "gateway": "10.56.217.1" } }
Events: <none>

# Trouble shooting
$ kubectl describe pods <pod name>
$ kubectl get <pod name> -o yaml

Python Script to get SR-IOV interface's IP address

#!/usr/bin/python
from kubernetes import client, config
import json
def main():
try:
config.load_kube_config()
v1 = client.CoreV1Api()
print("Listing nodes with their IPs:")
ret = v1.list_namespaced_pod('default')
for i in ret.items:
#print("%s\t%s\t%s" % (i.status.pod_ip, i.metadata.namespace, i.metadata.name))
annot = i.metadata.annotations
sriov_network_status = annot['k8s.v1.cni.cncf.io/networks-status']
d = json.loads(sriov_network_status)
for item in d:
if ('sriov' in item['name']) or ('macvlan' in item['name']):
for ip in item['ips']:
print(i.metadata.name, item['ips'])
except Exception as e:
pass
return isExt
if __name__ == '__main__':
main()

helloworld-python ['10.56.217.27']
helloworld-python-access-pod ['10.56.217.29']
testpod1 ['10.56.217.28']


Set Label "isext=true" on a Pod

$ kubectl label pods testpod1 isext=true

Python Script to get pod label of "isext"

#!/usr/bin/python
from kubernetes import client, config
import json
def get_label_isext(my_metadata):
try:
labels = my_metadata.labels
for k, v in labels.items():
if k == 'isext' and v == 'true':
return True
return False
except Exception as e:
return False
def main():
config.load_kube_config()
v1 = client.CoreV1Api()
ret = v1.list_namespaced_pod('')
for i in ret.items:
is_ext = get_label_isext(i.metadata)
print("pod:", i.metadata.name, "isExt:", is_ext)
if __name__ == '__main__':
main()

pod: helloworld-python isExt: False
pod: helloworld-python-access-pod isExt: False
pod: nfd-master-tk2g9 isExt: False
pod: nfd-worker-wdlmw isExt: False
pod: testpod1 isExt: True

安裝 DPDK 與 Pktgen on Ubuntu 18.04

 安裝 DPDK 與 Pktgen on Ubuntu 18.04

Compile and Install DPDK
sudo apt -y install vim git wget curl python3 python3-pip
sudo apt install build-essential libnuma-dev libpcap-dev linux-headers-`uname -r`

wget --no-check-certificate https://fast.dpdk.org/rel/dpdk-19.11.tar.xz
git clone git://dpdk.org/apps/pktgen-dpdk --depth=1

#build DPDK
export RTE_SDK=/home/dpdk1/git/dpdk
export RTE_TARGET=build
cd dpdk
make config T=x86_64-native-linux-gcc
make -j `nproc` T=x86_64-native-linux-gcc
make install


Compile Pktgen
sudo apt install -y lua5.3 liblua5.3-dev
make -j `nproc` T=x86_64-native-linux-gcc

配置huge page in memory
echo 1024 > /sys/devices/system/node/node0/hugepages/hugepages-2048kB/nr_hugepages
mkdir /mnt/huge
mount -t hugetlbfs nodev /mnt/huge


Thursday, September 16, 2021

BCC programming 筆記

安裝 BCC 使用 Source Code
For Bionic (18.04 LTS)

Install related libraries and packages
$ sudo apt-get -y install bison build-essential cmake flex git libedit-dev \
libllvm6.0 llvm-6.0-dev libclang-6.0-dev python zlib1g-dev libelf-dev \
iperf3 luajit libluajit-5.1-dev netperf linux-headers-$(uname -r)

Compile BCC source code and install
$ git clone --recursive https://github.com/iovisor/bcc.git
$ git submodule update --recursive
# Or $ git pull --recurse-submodules

$ mkdir bcc/build; cd bcc/build
$ cmake .. -DCMAKE_INSTALL_PREFIX=/usr -DPYTHON_CMD="python python3.8"
$ make -j `nproc`
$ sudo make install 


Quick Start Guide

A Docker container is provided for user to try out bcc.

From your host shell:

docker run -it --rm \
  --privileged \
  -v /lib/modules:/lib/modules:ro \
  -v /usr/src:/usr/src:ro \
  -v /etc/localtime:/etc/localtime:ro \
  --workdir /usr/share/bcc/tools \
  zlim/bcc

常用Linux Commands筆記

 Use rsync on my Windows 10 D:\SourceCode to sync folder from Linux's ~/SourceCode

rsync -r liudanny@<your IP address>:/home/liudanny/SourceCode /cygdrive/d/

List all users with their UID
awk -F: '{printf "%s:%s\n",$1,$3}' /etc/passwd

kubectl command completion in ~/.bashrc
# enable programmable completion features (you don't need to enable
# this, if it's already enabled in /etc/bash.bashrc and /etc/profile
# sources /etc/bash.bashrc).
if ! shopt -oq posix; then
if [ -f /usr/share/bash-completion/bash_completion ]; then
. /usr/share/bash-completion/bash_completion
elif [ -f /etc/bash_completion ]; then
. /etc/bash_completion
fi
fi

source <(kubectl completion bash)

Netfilter 研究筆記

 netfilter-like kernel module to get source and destination address

USDT Python Tracing 範例

 Reference for USDT Tracepoint for Python

https://github.com/paulross/dtrace-py
https://www.collabora.com/news-and-blog/blog/2019/05/14/an-ebpf-overview-part-5-tracing-user-processes/
https://github.com/iovisor/bcc/pull/698

Install build tools and python prerequisites
sudo apt install systemtap-sdt-dev

sudo apt install build-essential libssl-dev zlib1g-dev libncurses5-dev libncursesw5-dev libreadline-dev libsqlite3-dev libgdbm-dev libdb5.3-dev libbz2-dev libexpat1-dev liblzma-dev tk-dev libffi-dev

Download and extract python
wget https://www.python.org/ftp/python/3.7.0/Python-3.7.0.tar.xz
tar xf Python-3.7.0.tar.xz
cd Python-3.7.0
curl -o Python-3.7.0.tgz https://www.python.org/ftp/python/3.7.0/Python-3.7.0.tgz
tar -xzf Python-3.7.0.tgz
cd Python-3.7.0

BPFTrace 範例

BPFTrace
Install and compile
sudo apt-get update
sudo apt-get install -y bison cmake flex g++ git libelf-dev zlib1g-dev libfl-dev systemtap-sdt-dev binutils-dev
sudo apt-get install -y llvm-7-dev llvm-7-runtime libclang-7-dev clang-7
git clone https://github.com/iovisor/bpftrace
mkdir bpftrace/build; cd bpftrace/build;
cmake -DCMAKE_BUILD_TYPE=Release ..
make -j8

make install 

TCP/UDP Tracing

sudo bpftrace -e "$(cat udp_sendmsg2.bt)"
sudo bpftrace -e "$(cat udpconnect.bt)"
sudo python trace.py -I 'net/sock.h' 'udp_sendmsg(struct sock *sk) "daddr: %s, dport: %d", sk->sk_daddr, sk->sk_dport'

sudo bpftrace -e 'k:tcp_sendmsg,k:tcp_recvmsg {@[func,pid,tid,comm,args] = count();}'
sudo bpftrace -e 'k:tcp_sendmsg,k:tcp_recvmsg { @[func, pid, tid, comm] = count(); }'
sudo tcpdump -i any 'dst host 10.217.1.80 or dst host 10.217.1.50 or dst host 10.103.221.119 or dst host 10.110.176.166'

Golang 設定與常用指令說明

 Golang設定

加入下列於 ~/.profile
#Golang path
export PATH=$PATH:/usr/local/go/bin
export GOPATH=$HOME/go
export PATH=$PATH:$GOPATH/bin


常用的指令與使用說明
初始化 Module
這個會在資料夾底下產生一個初始的 go.mod 檔案
go mod init <module>
  • 在 build go 專案的時候,會根據 module name 的最後一路路徑 myproject 當作輸出檔名,會產生 myproject.exe 的檔案
  • 在 import 自己專案 package 的路徑的時候,github.com/mileslin/myproject 是根目錄,例如我新增一個 pg1 的 package ,則我在 import 的時候要輸入 import "github.com/mileslin/myproject/pg1"。

取得套件
go get -u github.com/gorilla/mux (-u 是說明,取得套件的時候不要從 cache 取得

#go get 的時候指定版本
go get github.com/gorilla/mux@v1.6.1
除了會新增一個 go.sum 檔案之外呢, go.mod 也會記錄你下載的套件,如下範例
module github.com/mileslin/myproject
go 1.13
require github.com/gorilla/mux v1.7.3 // indirect
// indirect 的意思是說,此套件還沒被用到。 所以只要在程式碼中使用此到件,並且 build 專案後,// indirect 就會消失
最後提一下,下載的套件會被放在 GOPATH/pkg/mod 底下。 (可以使用 go env 指令查看 GOPATH 路徑)

列出套件與套件版本
go list 取得可以使用的套件列表
$ go list all 會列出所有套件,包含 GOROOT 套件
$ go list -m all 只列出 module 列出的套件(包含自己的 package)
$ go list -m -versions github.com/gorilla/mux 列出此套件的所有版本

檢查套件使用情形
列出使套件在哪裡有被用到
$ go mod why github.com/gorilla/mux

Module download
這個會將 go.mod 定義的 library 都下載下來,但基本上 go build, go test 也會自動下載 library 並新增到 go.mod 上,
並會產出 go.sum 來確保 library 是否有更新。可以說能達到一樣的效果
go mod download

如果你忘了 import ,則會出現以下的錯誤
// github.com/streadway/amqp
go build -o ./bin/rabbitmq ./cmd
# rabbitmq/cmd
cmd/main.go:16:15: undefined: amqp
cmd/main.go:41:4: undefined: amqp

Module tidy
移除在 go.mod 不需要的 library
go mod tidy


go test
go test -timeout 30s ./probe/endpoint/... -run "TestSpyNoProcesses|TestSpyWithProcesses"
go test -timeout 30s ./probe/endpoint/...
go test -v -run=TestNewWithAssert ./example18-write-testing-and-doc/...

inspektor gadget 常用commands

 編譯與安裝kubectl-gadget

git clone https://github.com/kinvolk/inspektor-gadget.git
cd inspektor-gadget
make kubectl-gadget-linux-amd64
sudo cp kubectl-gadget-linux-amd64 /usr/local/bin/kubectl-gadget

佈署Gadgets on K8S 使用kubectl gadget
kubectl gadget deploy | kubectl apply -f -

or
#指定image
kubectl gadget deploy --image=kinvolk/gadget:fix63 | kubectl apply -f -
# make build & get image kinvolk/gadget:alban-fix63
kubectl gadget deploy --image=kinvolk/gadget:alban-fix63 | kubectl apply -f -

查詢在每個Node上的 gadget's pod name
kubectl get pod -n kube-system -l k8s-app=gadget -o=jsonpath='{.items[*].metadata.name}'
kubectl exec -it <gadget-xxxx> -n kube-system -- bash

Run BCC commands
$ kubectl gadget tcpconnect -A
$ kubectl gadget tcptracer -A


Traceloop
查看traceloop 清單
kubectl gadget traceloop list
NODE NAMESPACE PODNAME PODUID INDEX TRACEID CONTAINERID STATUS
ubuntu1804-k8s1 kube-system hubble-bdqn9 851a4185 0 0000b7ec718351b6 b2d36529 created 6 days ago
ubuntu1804-k8s1 default deathstar-657477f57d-crf8w bac896ec 0 0000b7f1f2b1d065 941b6b07 created 6 days ago
ubuntu1804-k8s2 kube-system coredns-6955765f44-nqr56 024f3577 0 0000541b48333690 62d1fade created 6 days ago
ubuntu1804-k8s2 kube-system coredns-6955765f44-pbwt5 00be4172 0 0000541b483869c5 59c000af created 6 days ago
ubuntu1804-k8s2 kube-system hubble-ui-7b767c4654-j7fs7 50ab917c 0 0000541b77264f34 dc9d5823 created 6 days ago
ubuntu1804-k8s2 default helloworld-golang cdb85f1e 1 0000eea8600e2b9a 82dfe69f created 4 days ago
ubuntu1804-k8s2 default helloworld-python 45139ac8 0 0000eea7d9821155 9147da4f created 4 days ago
ubuntu1804-k8s2 default deathstar-657477f57d-pflwg 63bd1b5d 0 00005421e8b30d05 fa336b14 created 6 days ago
ubuntu1804-k8s2 default helloworld-golang cdb85f1e 0 0000eeb0142b9961 b07b2652 created 4 days ago

traceloop 相關 commands
kubectl gadget traceloop pod default helloworld-golang 1
kubectl gadget traceloop show 0004ac1f39174f40

kubectl gadget traceloop pod sock-shop front-end-85c54f4fb-wftx6 0

# 須進入到gadget pod內才能使用
curl --silent --unix-socket /run/traceloop.socket http://localhost/dump-by-traceid?traceid=0000b7ec718351b6


Network Policy
Blog 介紹Network Policy Advisor

執行 network-policy monitor command
kubectl gadget network-policy monitor --namespaces default --output ./networktrace.log

製造traffic by curl
#For instance:
kubectl exec helloworld-python -- curl -s -XGET http://helloworld-golang.default.svc.cluster.local:8001/
kubectl exec xwing -- curl -s -XGET http://helloworld-python.default.svc.cluster.local:8080/

產生network-policy
kubectl gadget network-policy report --input ./networktrace.log > network-policy-default.yaml

Prometheus & Grafana & eBPF exporter 設定

 Prometheus


編輯 prometheus.yml
- job_name: "eBPF"
static_configs:
- targets: ['localhost:9435']

執行Prometheus, Grafana and ebpf_exporter
~/git/ebpf_exporter$ sudo ~/SourceCode/golang/bin/ebpf_exporter --config.file=examples/bio.yaml

cd ~/Prometheus/prometheus-2.16.0.linux-amd64
./prometheus --config.file=prometheus.yml

cd ~/Downloads/grafana-6.0.0
./bin/grafana-server web

# admin/bbyanlfe
#http://140.96.27.24:3000/dashboard/

eBPF exporter 使用說明
build eBPF exporter and run it
cd ~/SourceCode/go_SourceCode/ebpf_exporter
go build cmd/ebpf_exporter/main.go
sudo ./main --config.file=examples/timers.yaml --debbug

#http://140.96.27.24:9435/metrics

visual studio code to run ebpf_exporter with sudo
sudo code --user-data-dir=/home/liudanny/
### launch.json ###
{
// Use IntelliSense to learn about possible attributes.
// Hover to view descriptions of existing attributes.
// For more information, visit: https://go.microsoft.com/fwlink/?linkid=830387
"version": "0.2.0",
"configurations": [
{
"name": "Launch",
"type": "go",
"request": "launch",
"mode": "auto",
"program": "${workspaceFolder}/cmd/ebpf_exporter/main.go",
"env": {},
"args": ["--config.file=${workspaceFolder}/examples/timers.yaml"]
}
]
}

[Cilium] Hubble Source Code Study


Source Code Study:

https://github.com/cilium/cilium/blob/master/bpf/bpf_lxc.c#L1223
int handle_policy(struct __ctx_buff *ctx)
-> tail_ipv4_policy()
    |
    -> ipv4_policy()
        |
        V
        https://github.com/cilium/cilium/blob/master/bpf/lib/policy_log.h#L46
        send_policy_verdict_notify()
在此function放入 struct policy_verdict_notify 格式化的資料
        |
    -> ctx_event_output()
   (這function是被remap來自skb_event_output()
   會將event送到perf's ring buffer in Kernel)
  
#Cilium 有 perf reader 可以從 Kernel 讀 perf's ring buffer 然後解開msg
https://github.com/cilium/ebpf/blob/master/perf/reader.go


#另外一個會送send_trace_notify()的來源 (有很多bpf的點都會送)
https://github.com/cilium/cilium/blob/master/bpf/bpf_network.c
int from_network(struct __ctx_buff *ctx)
   |
   V
   https://github.com/cilium/cilium/blob/master/bpf/lib/trace.h
   send_trace_notify()
   這個function會發送packet tracing events是很重要的flow來源

#上面兩個例子的notify type 是 CILIUM_NOTIFY_POLICY_VERDICT & CILIUM_NOTIFY_TRACE
#到了Hubble就會是Flow (Layer3/4)主要來源
case monitorAPI.MessageTypeDrop,
monitorAPI.MessageTypeTrace,
monitorAPI.MessageTypePolicyVerdict:
return p.l34.Decode(payload, decoded)
case monitorAPI.MessageTypeAccessLog:
return p.l7.Decode(payload, decoded)

 
BPF datapath events 定義在這
https://github.com/cilium/cilium/blob/master/pkg/monitor/api/types.go


#跟container有關的send_trace_notify()的來源
https://github.com/cilium/cilium/blob/master/bpf/bpf_lxc.c
tail_handle_ipv4()
-> handle_ipv4_from_lxc()
   |
   V
   https://github.com/cilium/cilium/blob/master/bpf/lib/trace.h
   send_trace_notify()
../_images/hubble_getflows.png

測試:

kubectl get pods -n kube-system

kubectl exec -n kube-system ds/cilium -- cilium status
hubble observe --verdict DROPPED --pod XXX
hubble observe --since 3m --protocol http --output=json | \
jq -sr 'map(select(.l7.type=="RESPONSE" and .l7.http.method=="GET")) |
group_by(.l7.http.url) |
map({url: .[0].l7.http.url, max_latency_ms: ((map(.l7.latency_ns | tonumber) | max) / 1000000 }) |
sort_by(.max_latency_ms)'

hubble observe --since 3m --protocol tcp --output=json | \
jq -sr 'map(select(.l4.TCP.destination_port==8080)) |
group_by(.l4.TCP.flags)'

hubble observe --since=10m -t l7 -j \
| jq 'select(.l7.dns.rcode==3) | .destination.namespace + "/" + .destination.pod_name' \
| sort | uniq -c | sort -r

hubble-relay serve --peer-service=unix:///var/run/cilium/hubble.sock --listen-address=:4245

curl \
--silent \
--unix-socket /var/run/cilium/hubble.sock \
--request GET \
http://localhost/ \
| jq .


hubble serve --listen-client-urls=0.0.0.0:50051 --listen-client-urls=unix:///var/run/hubble.sock --metrics-server :6943 --metric=dns:query --metric=drop --metric=tcp --metric=flow --

[ODL] Import ODL Controller using Maven into Eclipse on Windows 10


Prerequisites

Java

目前使用的是OpenJDK, 需在Windows的系統環境變數做"JAVA_HOME"設定, 變數值為安裝的JDK路徑

Eclipse

需先在Windows 10上安裝Eclipse IDE, 目前使用的版本是 2019-09 R (4.13)

Maven

下載並解壓縮完成後, 請在系統環境變數做"MAVEN_HOME" and "M2_HOME"設定如下:

Import ODL Controller using Maven into Eclipse

Eclipse 環境設定 for Maven路徑


Install m2e plugin

Help --> Install New Software
在 "Work with" 選擇 m2e release repository 或是 自行增加 ( 輸入 URL 後按下 "Add" )
勾選Maven Integration for Eclipse, 然後按下 "Finish"

把Maven's "Plugin execution not covered by lifecycle configuration" 改選為 "Ignore"

Import ODL Controller


切換到 tag: v3.0.2
$git checkout tags/v3.0.2

Project --> Import

以上述方式import project, 只剩下這種的Maven Error:
"Execution generate-depends-file of goal org.apache.servicemix.tooling:depends-maven-plugin:1.4.0:generate-depends-file failed"

Wednesday, September 15, 2021

[eBPF] The example of using BCC's trace.py script


If you want to use a container to run BCC's script, you can follow the instructions to build a Docker image and run it as a container.

Dockerfile

FROM ubuntu:18.04

RUN apt update && apt install -y lsb-core vim curl cscope cmake ctags file git locales bison flex iperf netperf android-tools-adb build-essential libedit-dev zlib1g-dev libelf-dev tree wget openjdk-8-jdk libgtk-3-dev iputils-ping
RUN apt-key adv --keyserver keyserver.ubuntu.com --recv-keys 4052245BD4284CDD
RUN echo "deb https://repo.iovisor.org/apt/$(lsb_release -cs) $(lsb_release -cs) main" > /etc/apt/sources.list.d/iovisor.list
RUN apt update && apt-get install -y bcc-tools libbcc-examples

Build a Docker image
sudo docker build -t bcc-ebpf .

Run the Docker image as a container 
sudo docker run -d --name bcc \
    --privileged \
    -v $(pwd):/bcc \
    -v /lib/modules:/lib/modules:ro \
    -v /usr/src:/usr/src:ro \
    -v /boot:/boot:ro \
    -v /sys/kernel/debug:/sys/kernel/debug \
    bcc-ebpf sleep 3600d

The examples of using BCC's trace.py
python trace.py 'r:bash:readline "%s", retval'
python trace.py 'u:/lib/x86_64-linux-gnu/libc-2.27.so:memory_sbrk_more "%u", arg1' -T

./trace.py 'python:_PyImport_LoadDynamicModule "name: %s path: %s" arg1, arg2' \
        'r:python:_PyImport_LoadDynamicModule "at 0x%x" retval'

./trace.py 'r:bash:readline "%s" retval'

./trace.py '/home/bgregg/functions:main.add "%d %d" arg1, arg2'

# List functions in the executable file
readelf -s test
objdump -t test
objdump -D test


Reference:
Linux eBPF/bcc uprobes
http://www.brendangregg.com/blog/2016-02-08/linux-ebpf-bcc-uprobes.html
Using user-space tracepoints with BPF

[eBPF] An example of Userspace Tracing

#!/usr/bin/python

from __future__ import print_function
from bcc import BPF
from time import sleep

# load BPF program

b = BPF(text="""
#include <uapi/linux/ptrace.h>
struct key_t {
    char c[80];
};
BPF_HASH(counts, struct key_t);

int count(struct pt_regs *ctx) {
    if (!PT_REGS_PARM1(ctx))
        return 0;

    struct key_t key = {};
    u64 zero = 0, *val;
    bpf_probe_read(&key.c, sizeof(key.c), (void *)PT_REGS_PARM1(ctx));
    val = counts.lookup_or_init(&key, &zero);
    (*val)++;
    return 0;
};
""")

b.attach_uprobe(name="c", sym="strlen", fn_name="count")

# header
print("Tracing strlen()... Hit Ctrl-C to end.")

# sleep until Ctrl-C
try:
    sleep(99999999)
except KeyboardInterrupt:
    pass

# print output
print("%10s %s" % ("COUNT", "STRING"))
counts = b.get_table("counts")
for k, v in sorted(counts.items(), key=lambda counts: counts[1].value):
    print("%10d \"%s\"" % (v.value, k.c.encode('string-escape')))


Reference:
https://github.com/iovisor/bcc/blob/master/tools/bashreadline.py
https://github.com/iovisor/bcc/blob/master/tools/gethostlatency.py
https://github.com/iovisor/bcc/blob/master/tools/funccount.py
https://github.com/iovisor/bcc/blob/master/tools/memleak.py
https://github.com/iovisor/bcc/blob/master/tools/dbslower.py
https://github.com/iovisor/bcc/blob/master/tools/trace.py